

Table of Contents
The cryptocurrency market is showing strong bullish signals across major assets. XRP leads the charge with positive MACD indicators while Bitcoin and Dogecoin prepare for significant breakouts. These developments mirror broader trends in the stock market as digital assets gain mainstream acceptance.
Market conditions in September 2025 reveal compelling technical patterns across leading cryptocurrencies. Professional traders are watching key resistance levels closely. The convergence of technical indicators suggests potential upward momentum in the coming weeks.
Fed rate cut expectations are providing additional tailwinds for risk assets. This macro backdrop supports both traditional stock market investments and cryptocurrency positions. Understanding these interconnected dynamics helps investors make informed decisions.
Bitcoin Technical Analysis Shows Breakout Potential

Bitcoin currently trades near the $112,000 resistance zone after steady weekly gains. The hourly chart displays a classic inverse head and shoulders pattern. This bullish formation typically signals strong upward momentum when confirmed.
Technical indicators align favorably for Bitcoin’s next move higher. The 50-hour, 100-hour, and 200-hour moving averages show bullish realignment. Volume patterns support the potential for a decisive breakout above current levels.
Key Resistance Levels for Bitcoin
A confirmed breakout could target the $120,000 level based on technical projections. This represents approximately 7% upside from current trading ranges. Historical price action suggests Bitcoin often moves quickly once key resistance breaks.
Support levels remain strong around $108,000 and $105,000 if selling pressure emerges. These zones have provided reliable buying opportunities in recent weeks. The overall structure remains constructive for higher prices.
Market Sentiment Factors
Institutional demand continues supporting Bitcoin’s price foundation. ETF inflows provide steady buying pressure during market consolidations. Corporate treasury allocations add another layer of structural support.
Fed policy expectations create additional momentum for risk assets including Bitcoin. Rate cuts historically benefit assets with limited supply characteristics. Bitcoin’s fixed supply cap of 21 million coins appeals to inflation-conscious investors.

Dogecoin-Bitcoin Pair Shows Bullish Triangle Formation
The DOGE/BTC trading pair exhibits compelling technical patterns on shorter timeframes. Triangle compression suggests potential for significant directional movement. Breakout confirmation would signal Dogecoin outperformance versus Bitcoin.
Volume analysis supports accumulation beneath current resistance levels. Trading activity has increased during recent consolidation periods. This pattern often precedes strong momentum moves in either direction.
Critical Price Levels for Dogecoin
Dogecoin faces immediate resistance at $0.22 in USD terms. A sustained move above this level opens pathways to $0.24 and $0.28. These targets represent meaningful percentage gains from current prices.
The five-year performance statistics highlight Dogecoin’s volatility characteristics. Despite trading 69% below early 2021 peaks, long-term gains reach 7,570%. This demonstrates both opportunity and risk for position sizing decisions.
Market Cap Positioning
Dogecoin maintains its position as the 8th largest cryptocurrency by market value. The $35.4 billion market cap reflects significant institutional and retail interest. Ranking stability suggests established market presence despite meme coin origins.
Social media activity often drives short-term price movements in Dogecoin. Community engagement metrics provide early signals for momentum shifts. Traders monitor these indicators alongside traditional technical analysis.
XRP MACD Signals Confirm Uptrend Development
XRP demonstrates the strongest technical setup among major cryptocurrencies currently. The daily MACD histogram shows a positive crossover since Sunday’s trading session. This indicator shift typically precedes sustained upward price movement.
The descending triangle pattern spans nearly two months of price action. Triangle breakouts often produce measured moves equal to the pattern height. XRP’s setup suggests potential for a 23% advance if resistance clears.
Price Targets and Resistance Zones
XRP must overcome the $3.00 hurdle to confirm bullish triangle breakout. Success at this level targets the July 18 record high of $3.66. This represents substantial upside potential from current trading ranges.
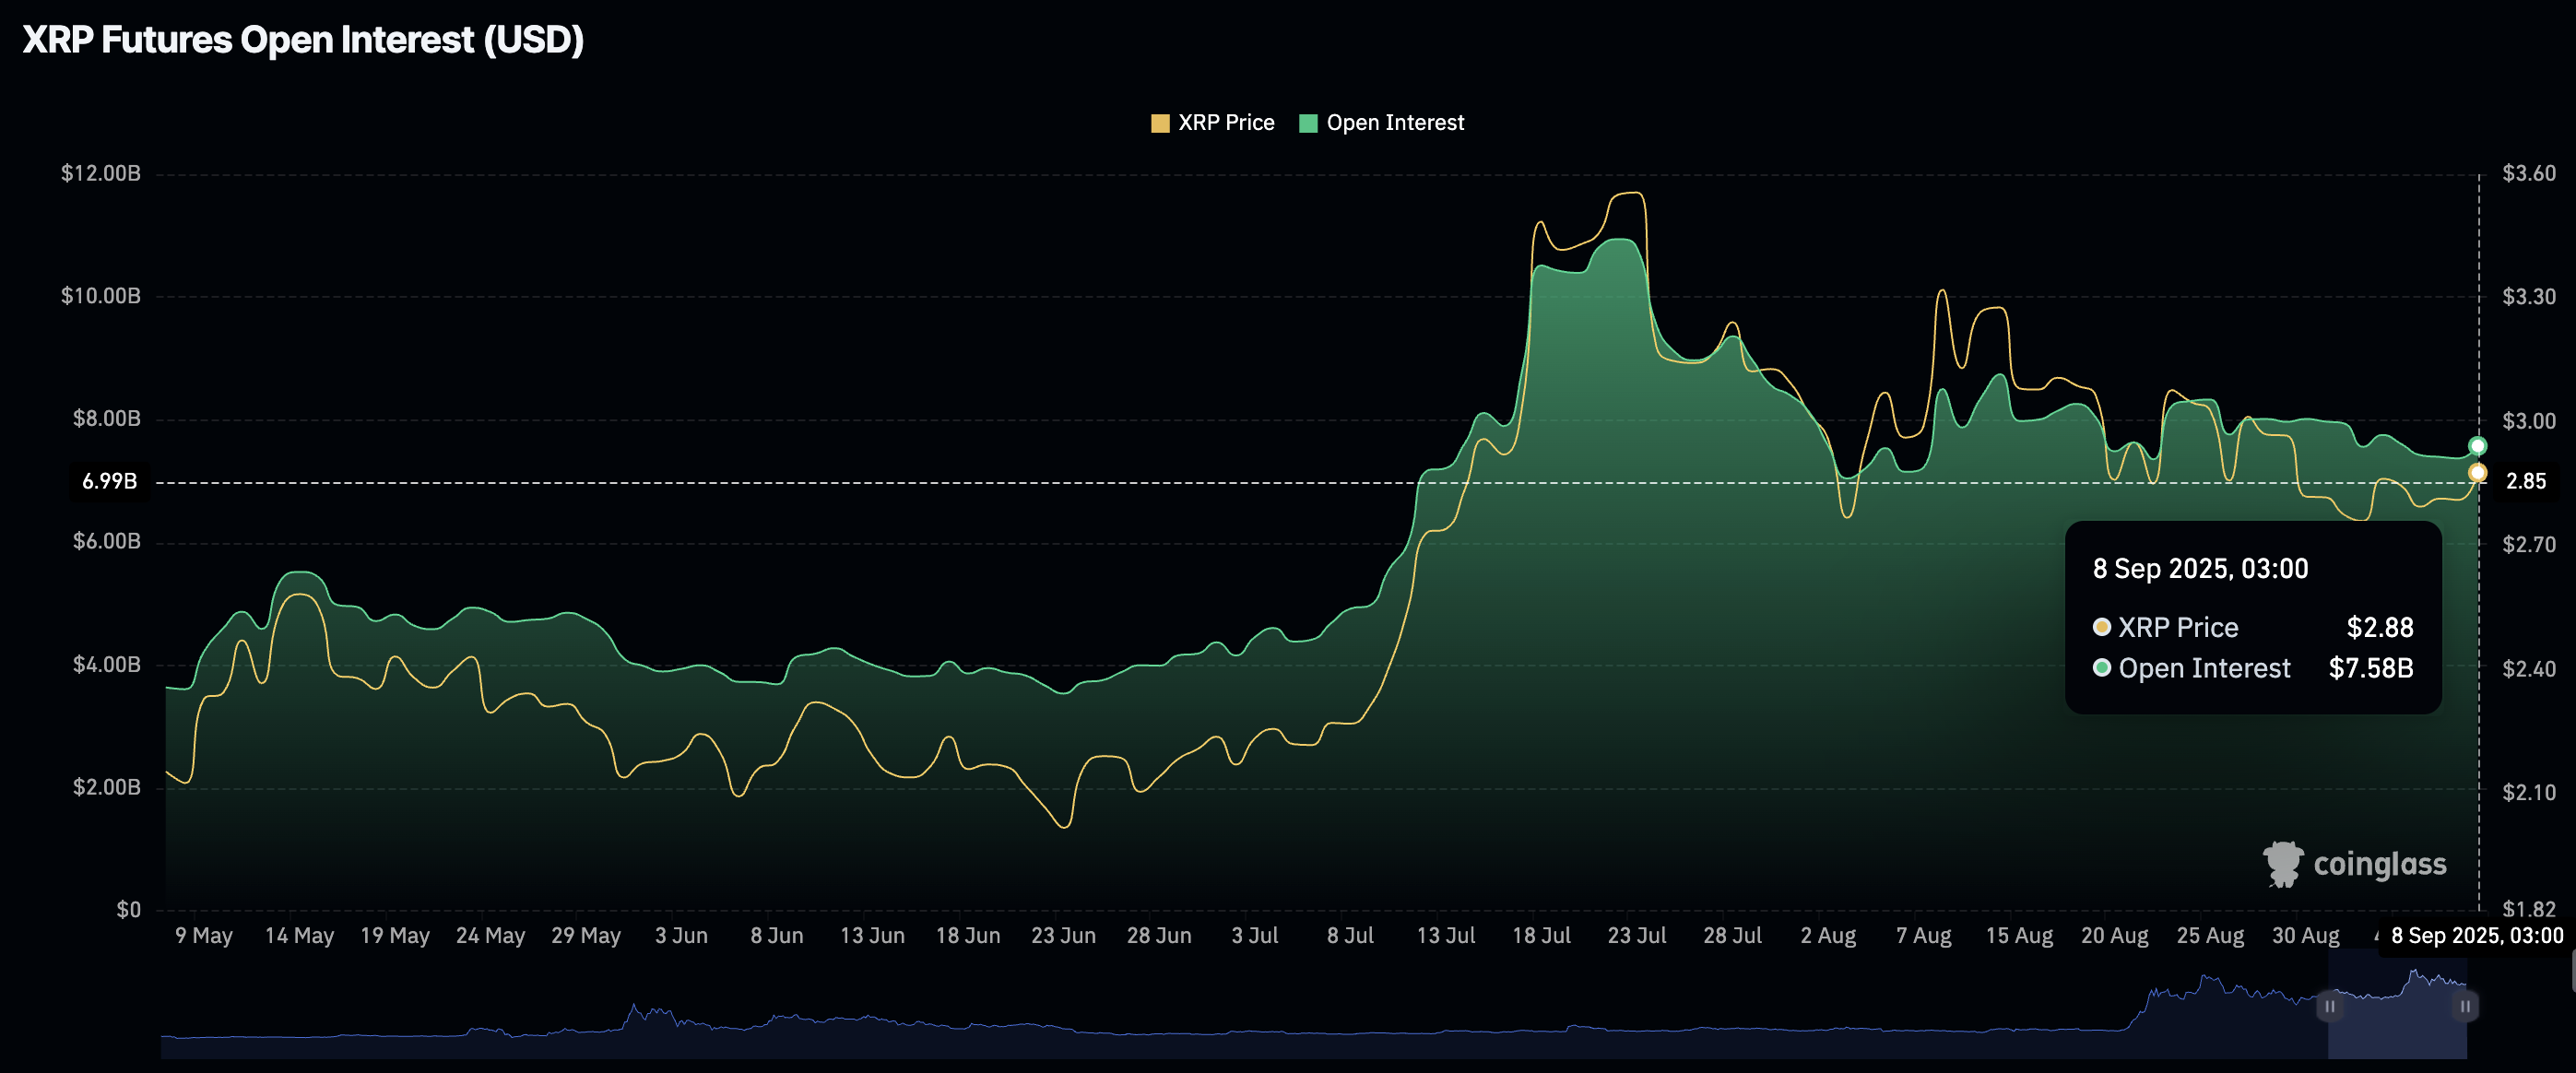
Futures market positioning supports the bullish technical outlook. Open interest has risen to $7.58 billion from $7.37 billion recorded on Sunday. The funding rate increase to 0.0083% from 0.0047% indicates growing long position interest.
Risk Factors for XRP
The Relative Strength Index shows signs of retreating from overbought territory. This development could delay the anticipated breakout timing. Traders should monitor RSI levels for momentum confirmation.
Stock market correlation remains a consideration for XRP positioning. Broader market weakness could pressure cryptocurrency advances despite positive technical setups. Risk management becomes crucial during uncertain macro environments.
Institutional Interest Indicators
Professional trader positioning supports XRP’s bullish outlook through derivatives markets. Increased leverage usage suggests confidence in directional movement. However, high leverage also amplifies potential volatility in both directions.
The cryptocurrency’s regulatory clarity advantages continue attracting institutional attention. Clear legal frameworks support long-term adoption prospects. This fundamental backdrop complements current technical patterns.

Fed Policy Impact on Cryptocurrency Markets
Expected rate cuts provide macro tailwinds for risk asset performance. Lower interest rates reduce opportunity costs for non-yielding assets like cryptocurrencies. This dynamic historically supports extended bull market periods.
Liquidity conditions improve as central bank policy becomes more accommodative. Enhanced market liquidity typically reduces volatility and supports trend continuation. These factors benefit both stock market and cryptocurrency investments.
Correlation Analysis
Cryptocurrency markets show increasing correlation with traditional risk assets. This relationship strengthens during periods of significant monetary policy changes. Investors must consider broader market dynamics when positioning in digital assets.
The stock market’s influence on cryptocurrency pricing has grown substantially. Major equity indices often lead cryptocurrency direction during volatile periods. Understanding these connections improves timing for entry and exit decisions.
Trading Strategy Considerations
Volume confirmation remains essential for validating breakout attempts across all three assets. False breakouts occur frequently in cryptocurrency markets without supporting volume. This metric provides crucial confirmation for position timing.
Risk management protocols should account for cryptocurrency’s inherent volatility characteristics. Position sizing becomes critical given potential for rapid price movements. Diversification across multiple assets can help manage concentrated risks.
Entry and Exit Planning
Bitcoin traders should monitor the $110,500 to $117,000 resistance confluence for breakout confirmation. Daily closing prices above this zone would strengthen bullish momentum. Failure to clear resistance suggests continued consolidation.
Dogecoin requires sustained acceptance above $0.22 to validate triangle breakout projections. Multiple rejection attempts at this level would indicate distribution rather than accumulation. Pattern failure could target lower support zones.
XRP needs daily MACD confirmation alongside price breakout above $3.00. Technical indicator alignment improves probability of sustained advances. Divergences between price and momentum indicators suggest caution.
Market Outlook and Conclusions
The September 2025 cryptocurrency landscape presents compelling opportunities across major assets. Bitcoin’s inverse head and shoulders pattern, Dogecoin’s triangle compression, and XRP’s MACD signals create diverse trading possibilities. These technical setups occur against favorable macro conditions.
Stock market strength and Fed policy expectations provide supportive backdrop for risk assets. Cryptocurrency markets benefit from improved liquidity conditions and institutional adoption trends. The combination of technical and fundamental factors suggests continued upward bias.
Risk factors include potential for false breakouts and broader market corrections. Cryptocurrency volatility requires careful position management and realistic expectations. Success depends on disciplined execution of predetermined trading plans.
The interconnected nature of modern financial markets means cryptocurrency performance increasingly correlates with traditional assets. Investors should monitor both sectors for optimal positioning strategies. This holistic approach improves risk-adjusted returns over time.
Disclaimer:
This is for information only, not financial advice. Always do your research.